Data points
The field types, how answers are saved, marking work as complete, and the toolbar on every question.
A data point is one question with one answer. It is the level at which most of the work happens.
Field types
The standard decides what kind of answer a data point takes, and The Cards renders the matching input.
| Type | What you get |
|---|---|
| Text | A rich-text editor, with headings, bold, italics, lists and links. |
| Number | A numeric field, with the unit shown after it where the standard defines one. |
| Percent | A numeric field with a per-cent suffix. |
| Date | A date picker. |
| Yes / no | Pick one of the two. |
| Structured | A small form generated from the standard's own structure: a set of tick boxes, a single choice from a list, or a mix of numbers, yes/no answers and free text. |
| Table | An editable table. Some tables let you add and remove rows; others have a fixed shape. Cells defined as a sum are calculated for you and cannot be typed into. |
Saving
There is no save button. Text saves shortly after you stop typing, or when you click away from the field. Anything you answer by choosing rather than typing, such as a yes/no, a tick box or a switch, saves the moment you choose it.
Nothing saves when the report is not Active, when the data point is marked completed, or when you only have read access. In those cases the input is visibly disabled.
Additional information
Many data points take a number, a date or a yes/no, which leaves no room to say how the figure was arrived at. Add additional information, under the answer field, opens a free-text field for exactly that: the method you chose, context the standard does not ask for, or a note to whoever fills in the field next period. It supports the same formatting as a text answer and saves like one, when you click away.
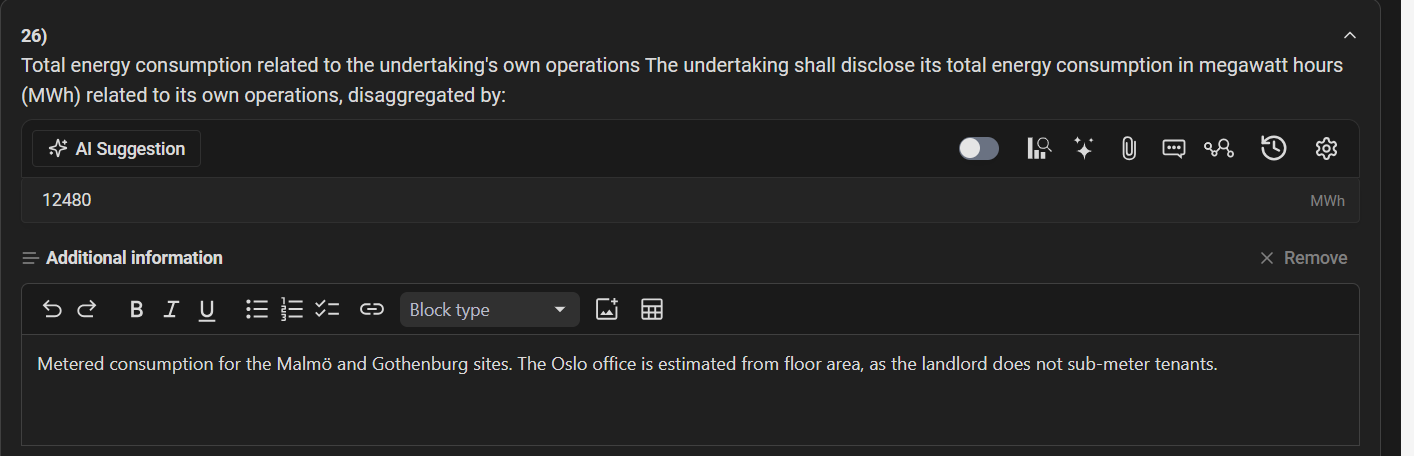
The text is a note about the answer, not part of it:
- It does not count as answering the data point, and it is not searched.
- It is left out of published reports unless the publication has Include additional information ticked.
- It has its own column in the Excel export.
- It is kept in the data point's history, so restoring an earlier version restores the note from that time too.
Remove hides the field and clears the text. Once a data point has additional information, it is always shown, so it is visible that there is more to the answer. The field is read-only under the same conditions as the answer itself.
Marking a data point completed
The Mark as completed switch above each data point says the answer is finished. A completed data point counts towards progress and becomes read-only, which protects it from accidental edits. Switch it off again to keep working.
The data point toolbar
Every data point has a row of actions above it. Each opens a panel on the right.
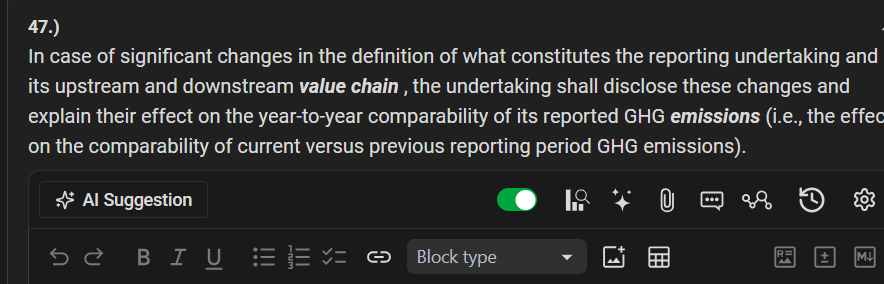
| Action | What it opens |
|---|---|
| AI Suggestion | Asks the assistant to draft a value for this data point. See AI suggestions. |
| Mark as completed | The switch described above. |
| Gap analysis | Records how far you are from being able to answer. See Gap analysis. |
| AI Assistant | A chat scoped to this data point. See AI assistant. |
| Attachments | Files that evidence this answer. See Attachments. |
| Comments | Discussion threads. See Comments. |
| Related items | The same data point as answered in your other reports. |
| History | Every saved version, and restore. See History. |
| Settings | Switch the data point off for this report. Needs write access. |
The attachment and comment icons change appearance when the data point already has attachments or threads, so you can see at a glance which questions have material behind them.
Related items
Related items shows how the same data point was answered in your organisation's other reports, with the report name and period, and a link straight to it. This is the quickest way to check what you said last year without opening the old report.